Comprehensive QFD developed by the late Yoji Akao included four major vertical deployments: quality, technology, cost, and reliability. These vertical deployment are then crossed with horizontal deployments for customer/user, function, system, component, and build process. The purpose of the vertical deployments is to examine different design dimensions and the horizontal deployments to do this at each level of the product/service development process. The overall goal is to assure customer satisfaction with the new product or service.
These deployments are covered extensively in Akao's 1990 book "QFD: Quality Function Deployment - Integrating Customer Requirements into Product Design," Bob King's 1997 book "Better Designs in Half the Time," and in ISO 16355-1:2015, ISO 16355-5:2017, and ISO/TR 16355-8:2017 from the new standard for QFD.
Quality deployment is to assure that the product specifications are sufficient to meet the customers' needs and usually includes either or both a Maximum Value table or House of Quality. Technology deployment is to assure that new technologies that are employed will function in the targeted application or environment, or when solutions are lacking, they can be innovated with customer satisfaction as the driver. Cost deployment is to assure that target costs based on the marketing strategy are proportionately distributed to the various subsystems and components during the design phase. Reliability deployment is used to assure that failure modes are identified and prioritized based on their impact on the customer.
Given the trend in new products to employ software-based solutions to enhance functionality, portability, and usability, it has become unmistakably clear that a new vertical deployment should be added to QFD - Security Deployment, and like the other deployments, it should be intersected by the horizontal deployments of customer/user, function, system, component, and build process. Other horizontal deployments may also be necessary.
Dr. Akao keynoted the 2007 QFD Symposium by presenting the work by Hitachi Omron Terminal Solutions, Ltd. on "QFD and Knowledge Management: QFD Application on the Development of a Finger Vein Authentication Device". The technology was based on a medical application and then used to develop a new product for the financial and security industries.
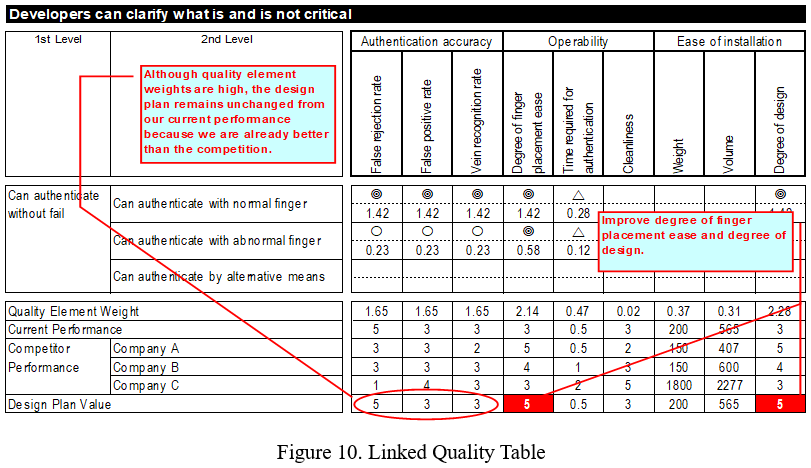
In this extremely detailed case study, Dr. Akao wrote, at that time, "Among the many bio-metric authentication methods, it is the only type that uses the internal physiological characteristics that are invisible externally, making forgery very difficult. This next generation bio-metric authentication technology captures high-contrast maps of finger veins from an image obtained from light transmission, with the help of artificial intelligence, and matches them to the pre-registered vein patterns to authenticate the identity of an individual." Difficult to forge ... until now.
Joseph Cox and Max Hoppenstedt reported in the December 27 2018 online edition of Motherboard, titled "Hackers Make a Fake Hand to Beat Vein Authentication", that two Germans, Jan Krissler and Julian Albrecht reported using off-the-shelf materials to replicate a human hand's veins and trick the security system.
As these security systems are used by governments, financial institutions, and others, it is yet another example of the never ending cat-and-mouse game played by technologies and hackers. We have seen this game take on computer systems in banks, power companies, political parties, entertainment companies, hotels, department stores, social media companies, hospitals, local governments, and the list goes on.
What can QFD do to help?
Like in many Systems Engineering problems, it is useful to begin by separating the problem space from the solution space. By creating a vertical Security Deployment, we can look at the problem space from multiple perspectives. Here are some possible charts that may be used.
Security Tree Analysis (STA). Similar to Fault Tree Analysis (FTA), we can structure known security breaches and probabilities into a hierarchy diagram. One of the benefits of a hierarchy diagram to use the structure to identify missing unknown or possible breaches. This STA becomes the "cap" of the Security Deployment.
Customer Needs - Security Matrix. This chart juxtaposes prioritized customer needs from the House of Quality rows with the Security Tree in order to examine the strength of the relationship each security breach has on customer needs. These relationships can be weighted using the AHP-derived ratio scale weights indicated in ISO 16355-5:2017, because ratio scale weights can accurately multiplied by customer need weights (also AHP-derived as described in ISO 16355-4:2017) to prioritize the security breaches. These priorities reflect the impact on customer satisfaction directly.
Functional Requirements - Security Matrix. This chart juxtaposes the prioritized functional and non-functional requirements from the House of Quality columns (now rotated into the rows) with the Security Tree in order to examine the strength of the relationship each security breech has on product/service function and performance. As above, AHP-derived weightings in ratio scale should be used to accurately prioritize the security breaches. These priorities reflect the impact on product/service performance.
Function - Security Technology Matrix. This chart can be be used to prioritize which security technologies (for example block-chain) best support the functions of the product or service. Functions can include either or both the product/service functions or the security functions.
System/Subsystem - Security Matrix. This chart juxtaposes prioritized product/service systems, subsystems, mechanisms, interfaces, etc. with the Security Tree in order to examine the strength of the relationship each security breach has at the system and subsystem level. As above, AHP-derived weightings in ratio scale should be used to accurately prioritize the security breaches. These priorities reflect the impact on product/service at a system level in order to focus the development of countermeasures.
Component - Security Matrix. This chart juxtaposes prioritized components or parts, software, apps, etc. with the Security Tree in order to examine the strength of the relationship each security breach has on purchased or supplies parts, externally developed software, etc. As above, AHP-derived weightings in ratio scale should be used to accurately prioritize the security breaches. These priorities reflect the impact on product/service at a component level in order to focus on internal production processes or to develop criteria for vendor selection.
Build - Security Table. This table looks at each stage of the build, assembly, software loading, software updating in the field, and other processes involved in commercializing, installing, maintaining, and servicing the product in the field by examining the impact and mitigation of each security breach when implementing the new product/service.
The QFD Institute is now developing these new tools for training in a number of industries including health care and IT products and services.
Today security concern is everybody's business today, not limited to the responsibility of IT and engineering, since a single security breach could wreck an otherwise well-designed new product or a business plan. To begin your journey to understanding how ISO QFD tools could be useful for your work, we invite you to the upcoming training. For questions, please contact us.