How to structure complex decisions, so that the best alternative can be chosen, was discussed in the previous newsletter using an example of U.S. Medicare insurance coverage for senior citizens.
One always worries that you either bought too little or paid too much. A colleague once told me "nobody ever gets fired for over-purchasing." Yet, with health insurance, one hopes one NEVER needs to use it, because that means something is wrong with your health.
Three problems (below) were introduced last time. Let's look at how the QFD (Quality Function Deployment) and related tools and techniques from ISO 16355 can help solve them.
Medicare plan descriptions give functional requirements, not benefits or needs. Customers have to translate the product requirements into needs, and we risk making assumptions that later prove to be incomplete or false.
How to balance costs between monthly premiums, co-insurance, and co-pays.
How to select the best plan from the many alternatives.
Here are ways to use our ISO 16355 QFD tools and techniques:
Customer Voice table and Wishbone diagrams (ISO 16355-4:2017 Clause 10)
Medicare's Outline of Coverage lists hospital coverage (co-pays change as the number of days in the hospital change), blood benefit, skilled nursing facility care, hospice care, emergency care outside U.S., physician and outpatient services, clinical laboratory services, and home health care services.
These are product/service functions. The benefits they provide to the customer are not explicitly explained. Medicare publishes an explanatory booklet called "Medicare & You" each year that details the services, but still not the benefits. For example,
Blood. If the hospital gets blood from a blood bank at no charge, you won't have to pay for it or replace it. If the hospital has to buy blood for you, you must either pay the hospital costs for the first three units of blood you get in a calendar year or have the blood donated by you or someone else.
This doesn't explain why I would want this benefit, it just raises more questions. Why would I need blood? What diseases or surgeries would most likely require it? How much would it require? Is three units typical? Is it enough for one operation or three in a year? How much does the hospital pay for blood? If a doctor's error results in needing more blood, who pays for it? What happens if I don't get blood?
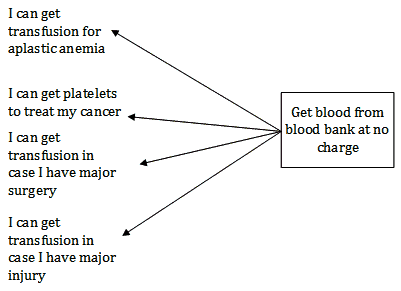
The QFD's customer voice table or a wishbone diagram can help translate these services into "true" customer needs (why I want this), that are independent of the product or service. Here is an example of a wishbone diagram for blood. It examines many kinds of conditions for me to prioritize.
Balance costs of various options based on impact, likelihood, and early detectability of the above conditions.
Adapting a (failure mode and effects analysis (FMEA) as shown in ISO 16355-5:2017, Clause 10.4.5.8 to this purpose, we can prioritize the conditions. We can add additional factors such as survivability, if useful.
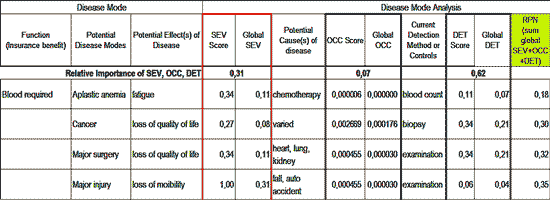
This chart shows the impact of the above conditions on a senior citizen's life, the likelihood of a senior having a condition, and the importance of early detection that having good health insurance coverage can allow. The steps and numbers shown are explained in the QFD Black Belt® course and the ISO 16355-5:2017.
Selecting the best plan.
Generally, seeing the same primary care physician (PCP) with privileges to a major hospital will help educate seniors about changing disease conditions and life functions. Continuing to see the same doctors allows them to track these changes over time and better treat the senior patient. This must be balanced against immediate and future out-of-pocket costs for the insurance and necessary treatments.
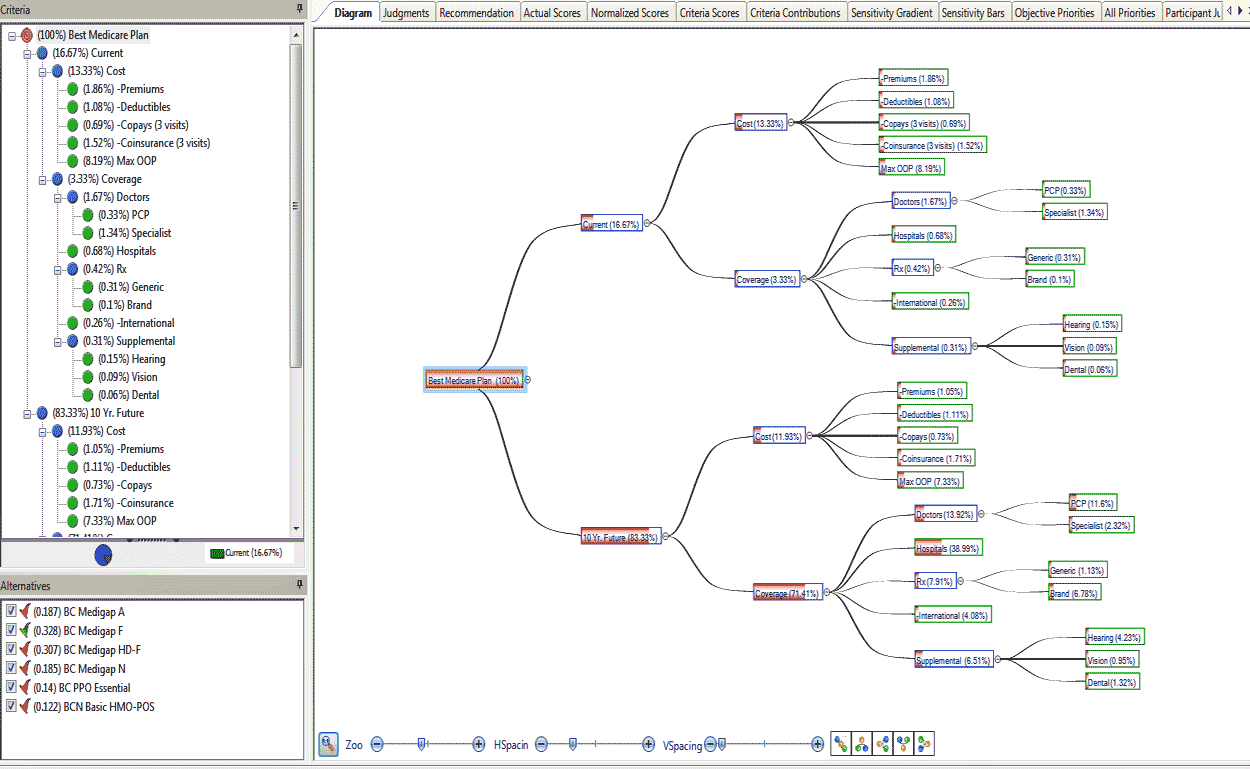
The analytic hierarchy process (AHP) in ISO 16355-2:2017 Clause 9.1.2.8 can be used to prioritize the insurance coverage vs. cost over time. The chart shows how current and future costs and coverages for hospitals, doctors, and drugs could be prioritized, and then used to select the best Medicare insurance plan.
These analyses can be updated as needed by the senior citizen or care givers.
While the complexity of the coverage and cost choices are significant, the QFD and related tools and methods in ISO 16355 can bring structure to the decision making process, allowing analysis of discrete decisions instead of trying to juggle the complexity at one time, as shown here.
These tools and techniques can be used in any applications and industries, including determining customer needs priorities, decision making involving competing stakeholders, allocating resources most effectively, and sorting out complex factors and situations.
The Customer Voice table/Wishbone diagram and AHP discussed here, including templates, are part of the next QFD Green Belt® class.
The steps of FMEA AHP and decision making methods are taught in the QFD Black Belt® Course.
For questions, please contact the QFD Institute.