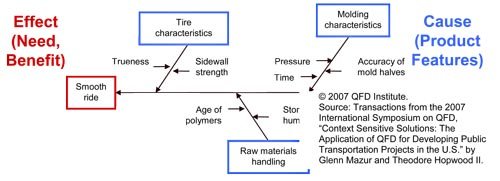
One of the most powerful quality tools is the well known fishbone diagram (example in the graphic panel below), pioneered by the Japanese quality sensei, Dr. Kaoru Ishikawa.
While often translated into "cause-and-effect" diagram, Dr. Noriaki Kano pointed out in his keynote address to the 2016 EOQ Congress in Helsinki, a better translation would be a "characteristic-factor" diagram, a direct translation of the original Japanese.
Characteristics and Factors
Characteristics and factors allow for a more universal application of the tool, which helps us understand QFD better. Within the Six Sigma DMAIC process, characteristics are readily defined as problem statements of negative quality. Similarly, factors can be easily defined as the causes of the problem.
In the most basic of fishbone diagrams, the categories of causes are labeled the 4Ms, which stand for man, machine, material, and method. They were to be explored in that order, from simplest to address to most difficult. That is, problems related to the workers that could be immediately remedied by training, better operating procedures, etc. should be investigated first. If the cause of the problem was not there, then the machines and equipment would be investigate for improper settings, loose or damaged parts, etc. If the cause of the problem was not there, then the materials would be investigated for conformance to specifications, defects, inconsistencies, etc. If the cause of the problem was not there, then the method of producing the product would be investigated for design and other issues.
These days, additional Ms such as money, management, metrics, measuring equipment, and others have been added. QFD founder Dr. Akao calls this the analytic approach where you start at the end of the process and look step-by-step upstream towards design.
QFD Process
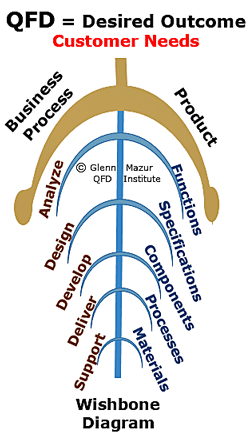
In the QFD process, however, characteristics are more readily defined as desired or wished-for outcomes of the product, which we can call customer needs or benefits. Similarly, factors can be easily defined as the contributors necessary to fulfilling the wishes. Thus, Glenn Mazur of the QFD Institute has coined the term "wishbone diagram" (the diagram in the graphic panel above).
In the most basic of wishbone diagrams, the categories can sometimes be the same 4Ms, but the sequence of analysis is reversed. In QFD, Dr. Akao calls this the design approach where you start at the design phase and look downstream at each dimension of the product development process ending in the build, assembly, service delivery, and other human tasks, and even further downstream to support, maintenance, and even retirement from the field.
With Modern QFD
In Modern QFD, the wishbone diagram is critical in two phases. First is in finding unspoken customer needs; second is in developing solutions to those needs. Because both the purpose and the sequence of use in QFD is the opposite of fishbone diagrams, QFD reverses the positions of the "head" and "bones."
The wishbone, by the way, is the fused clavicles or furcula found in birds (see the photo below). Ancient Romans, when serving a whole chicken or turkey, considered it a symbol of good luck. As the Romans spread through Europe, this custom was used to predict the weather and even the outcomes of battles. In the 17th century, it became custom for two people to grasp each end and break the bone, with the person holding the larger half making a wish. The bone was called a 'merrythought' in England, and was later renamed 'wishbone' in the U.S.
Wishbone Analysis
The wishbone diagram build and analysis is the core of the QFD Green Belt® training. Master this, and it may be the fastest QFD you could ever wish for!
For questions, please contact the QFD Institute.